Collaboration Dashboard
The Collaboration Dashboard is a comprehensive tool designed to help you manage passengers travelling through your network via collaborative agreements (such as interlining or partnership networks). It provides real-time insights into passenger flows, bottlenecks, and revenue potential, allowing you to optimize your network efficiency.
To access the dashboard, navigate to your company menu and select Collaboration Dashboard.
Key Metrics
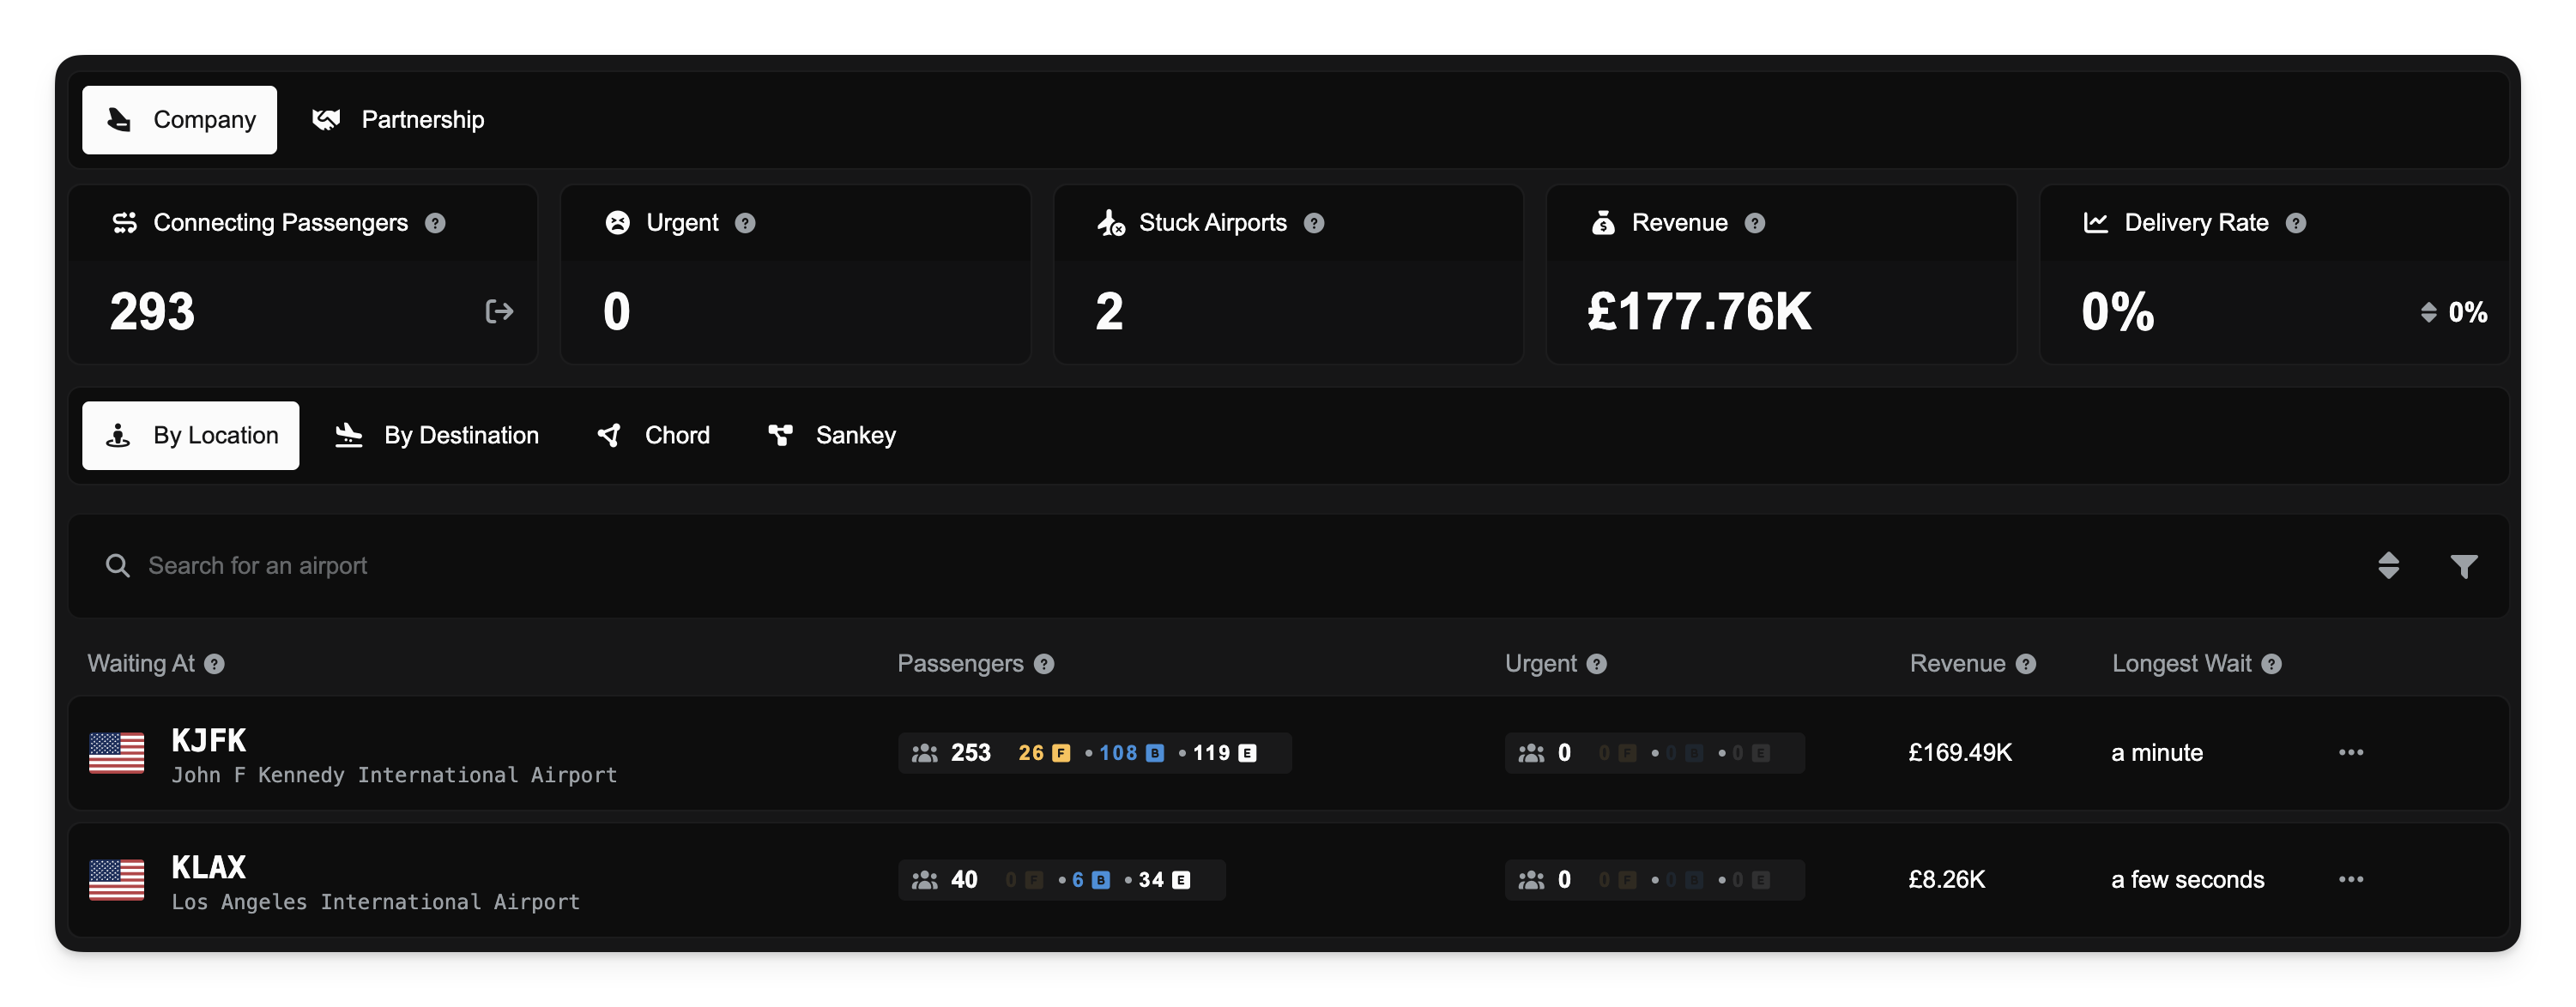
At the top of the dashboard, you will see a series of panels providing a high-level overview of your collaborative network's health. You can toggle the scope of these metrics between Company (your specific passengers) and Partnership (the aggregate of the partnership you belong to) using the tabs at the top left.
Connecting Passengers: The total number of passengers currently in transit within your network who have not yet reached their final destination. These passengers are waiting at an airport for their next flight.
Urgent: Passengers who have been waiting for a flight longer than the acceptable threshold (currently 14 days).
Stuck Airports: The count of unique airports where passengers are currently waiting. A high number here may indicate specific hubs that are serving as bottlenecks.
Revenue: The total potential revenue available from all current collaborative demand in your network. This is realized only when passengers are delivered.
Delivery Rate: The percentage of passengers successfully delivered to their final destination within the last 30 days, calculated by passenger count. The trend indicator (↑ improving, ↓ declining) shows how this rate compares to the previous 30-day period.
Delivered Passengers: The total number of passengers successfully delivered to their final destination within the last 30 days. This is shown alongside the delivery rate in the By Company view when using Partnership scope.
Visualizing Demand Flows
Below the metrics panels, the dashboard offers several ways to visualize how passengers are moving through your network. You can switch between these views using the tabs above the main display area.
Table Views
By Location: Displays demand grouped by the airport where passengers are currently waiting. This helps you identify where you need to send aircraft to pick up passengers.
By Destination: Displays demand grouped by the airport the passengers are trying to reach. This helps you plan routes to specific destinations.
Clicking on any airport row in these tables will open a detailed dialog showing the breakdown of passengers (First, Business, Economy) and specific revenue details for that location.
Graphical Views
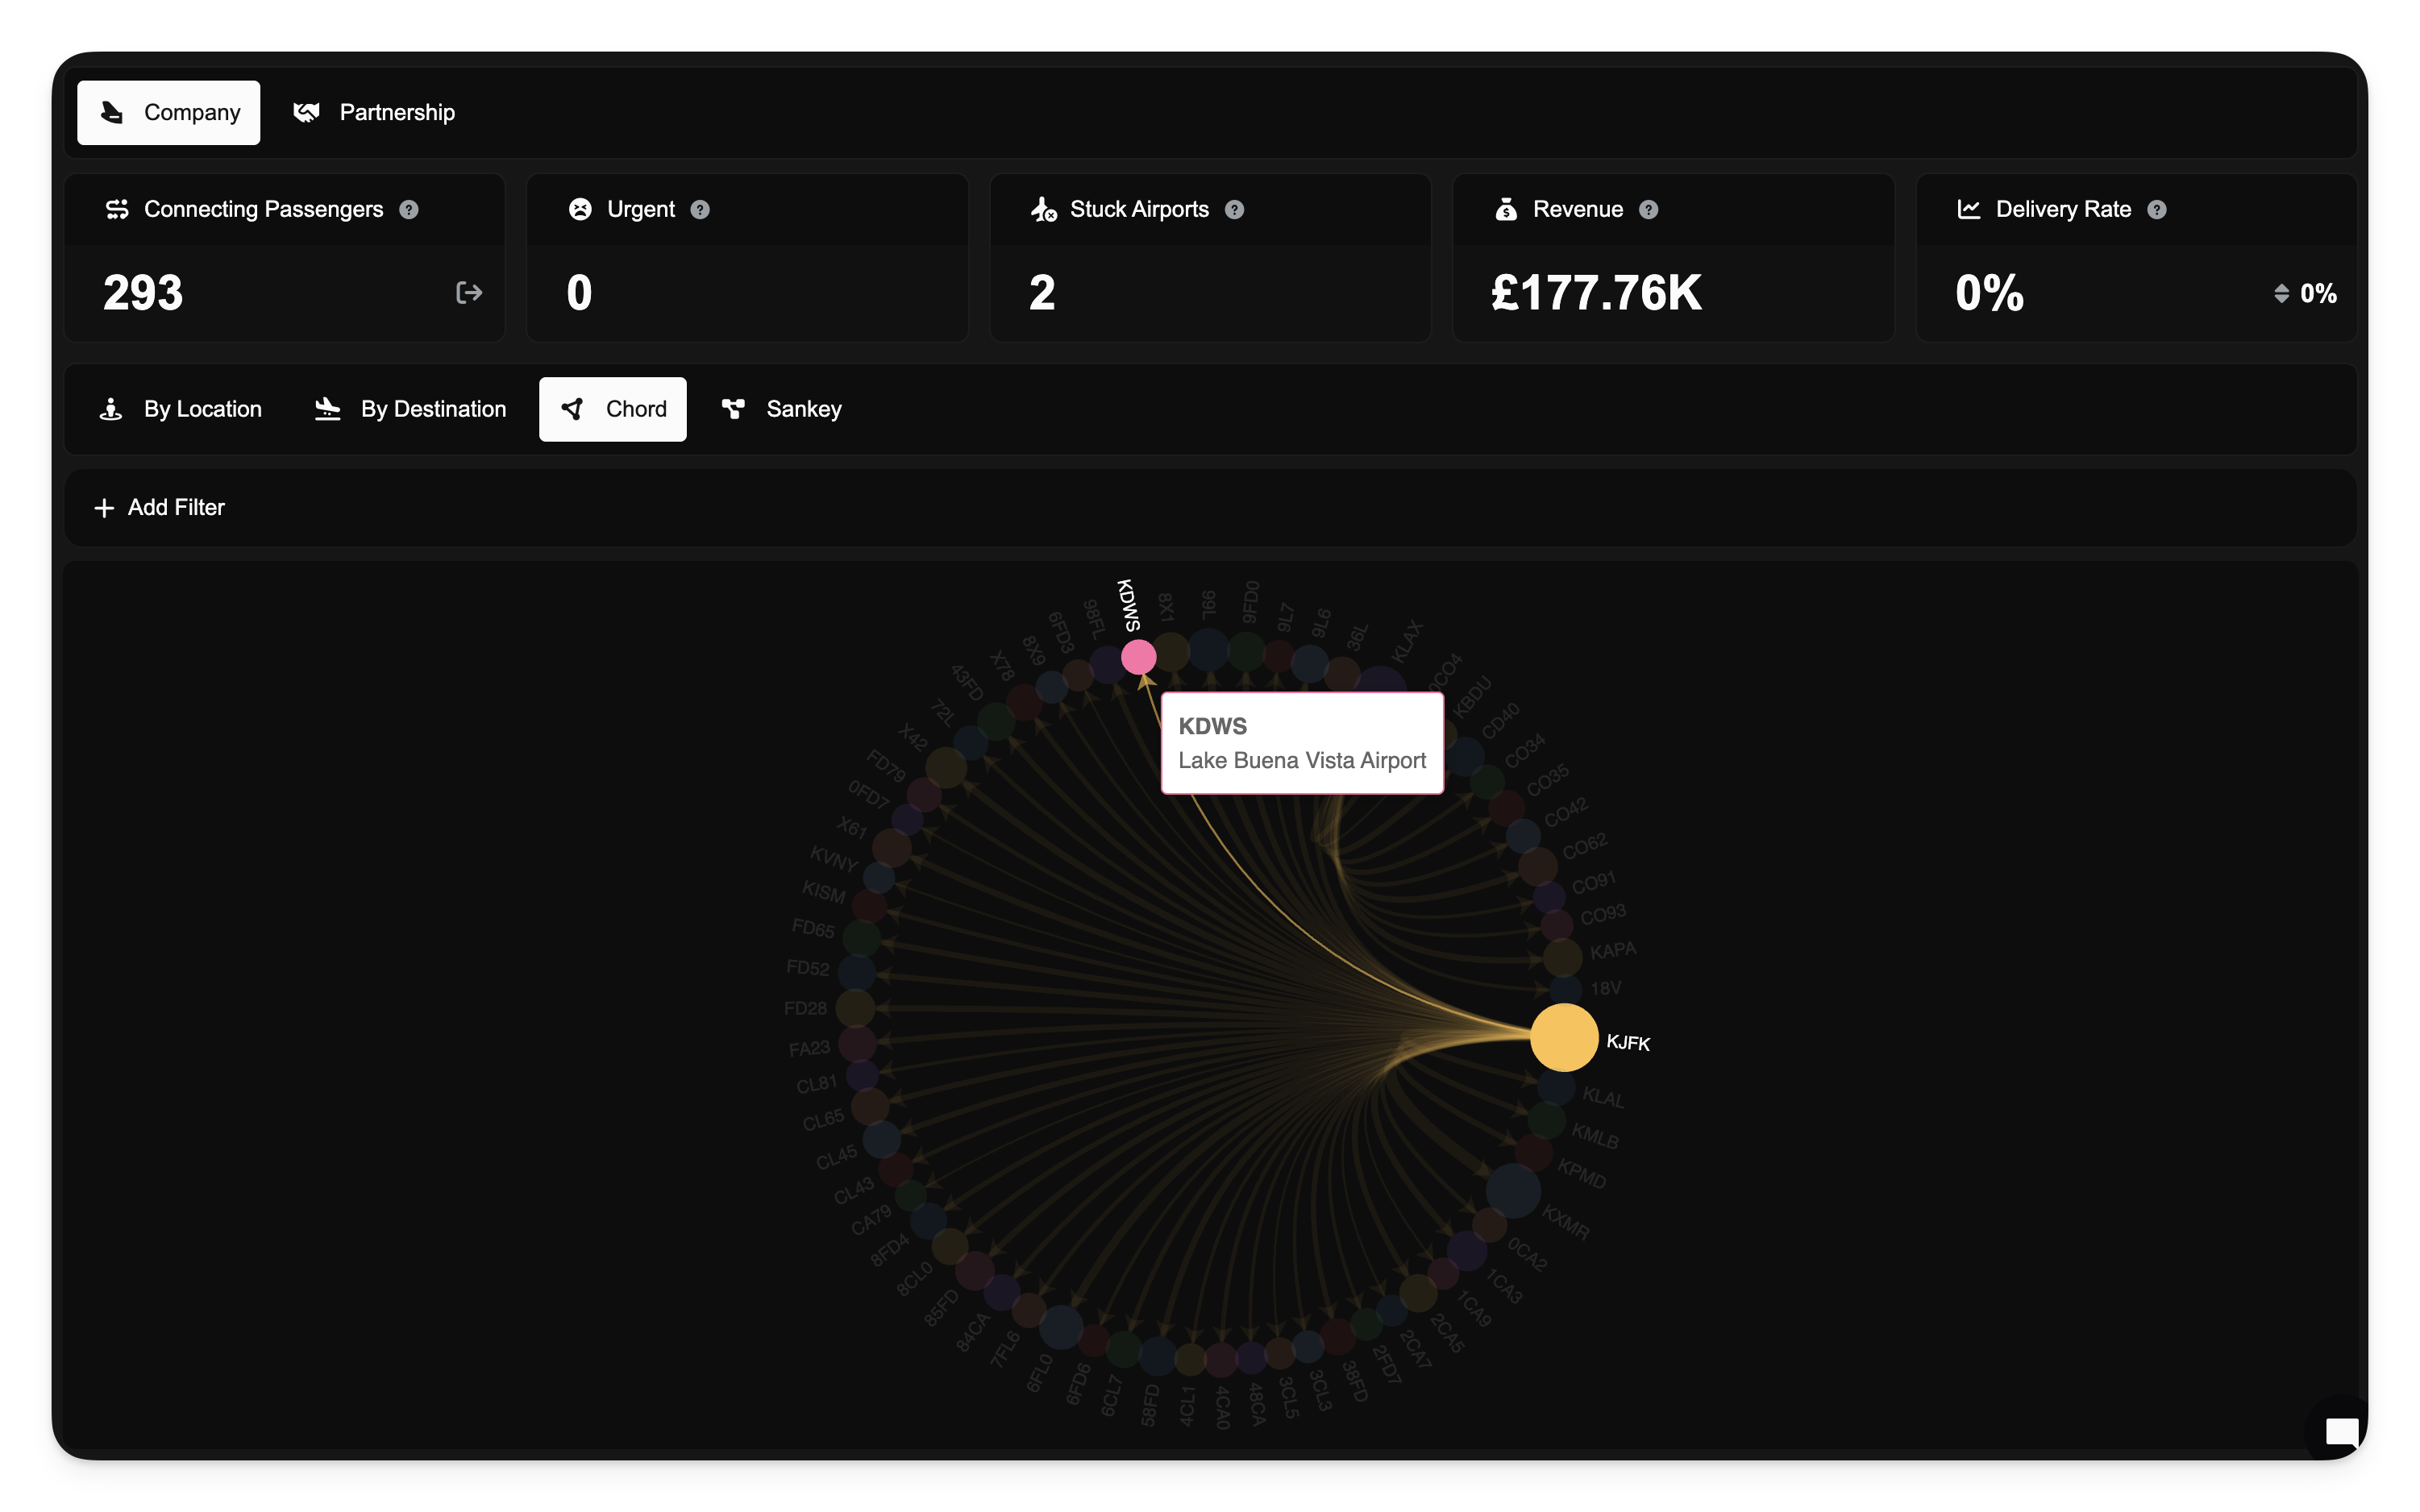
For a macro-level view of your network, you can select the Chord or Sankey tabs. These provide visual diagrams of your passenger flows.
Chord Diagram: Visualizes the relationships and volume of flows between airports in a circular layout.
Sankey Diagram: Shows the flow of passengers from source to destination, with the width of the lines representing the volume of passengers.
Map
The Map tab provides a geographic view of your collaborative passenger flows. It displays a flow map overlaid on a world map, showing the volume and direction of passenger movement between airports.
Hover over an airport to see a tooltip with the total passenger count. Press i or o on your keyboard respectively to view the incoming or outgoung passengers to that airport.
Use the same filters available in the Chord and Sankey views to narrow the data
This view is particularly useful for understanding the spatial distribution of your collaborative network.
Partner Share
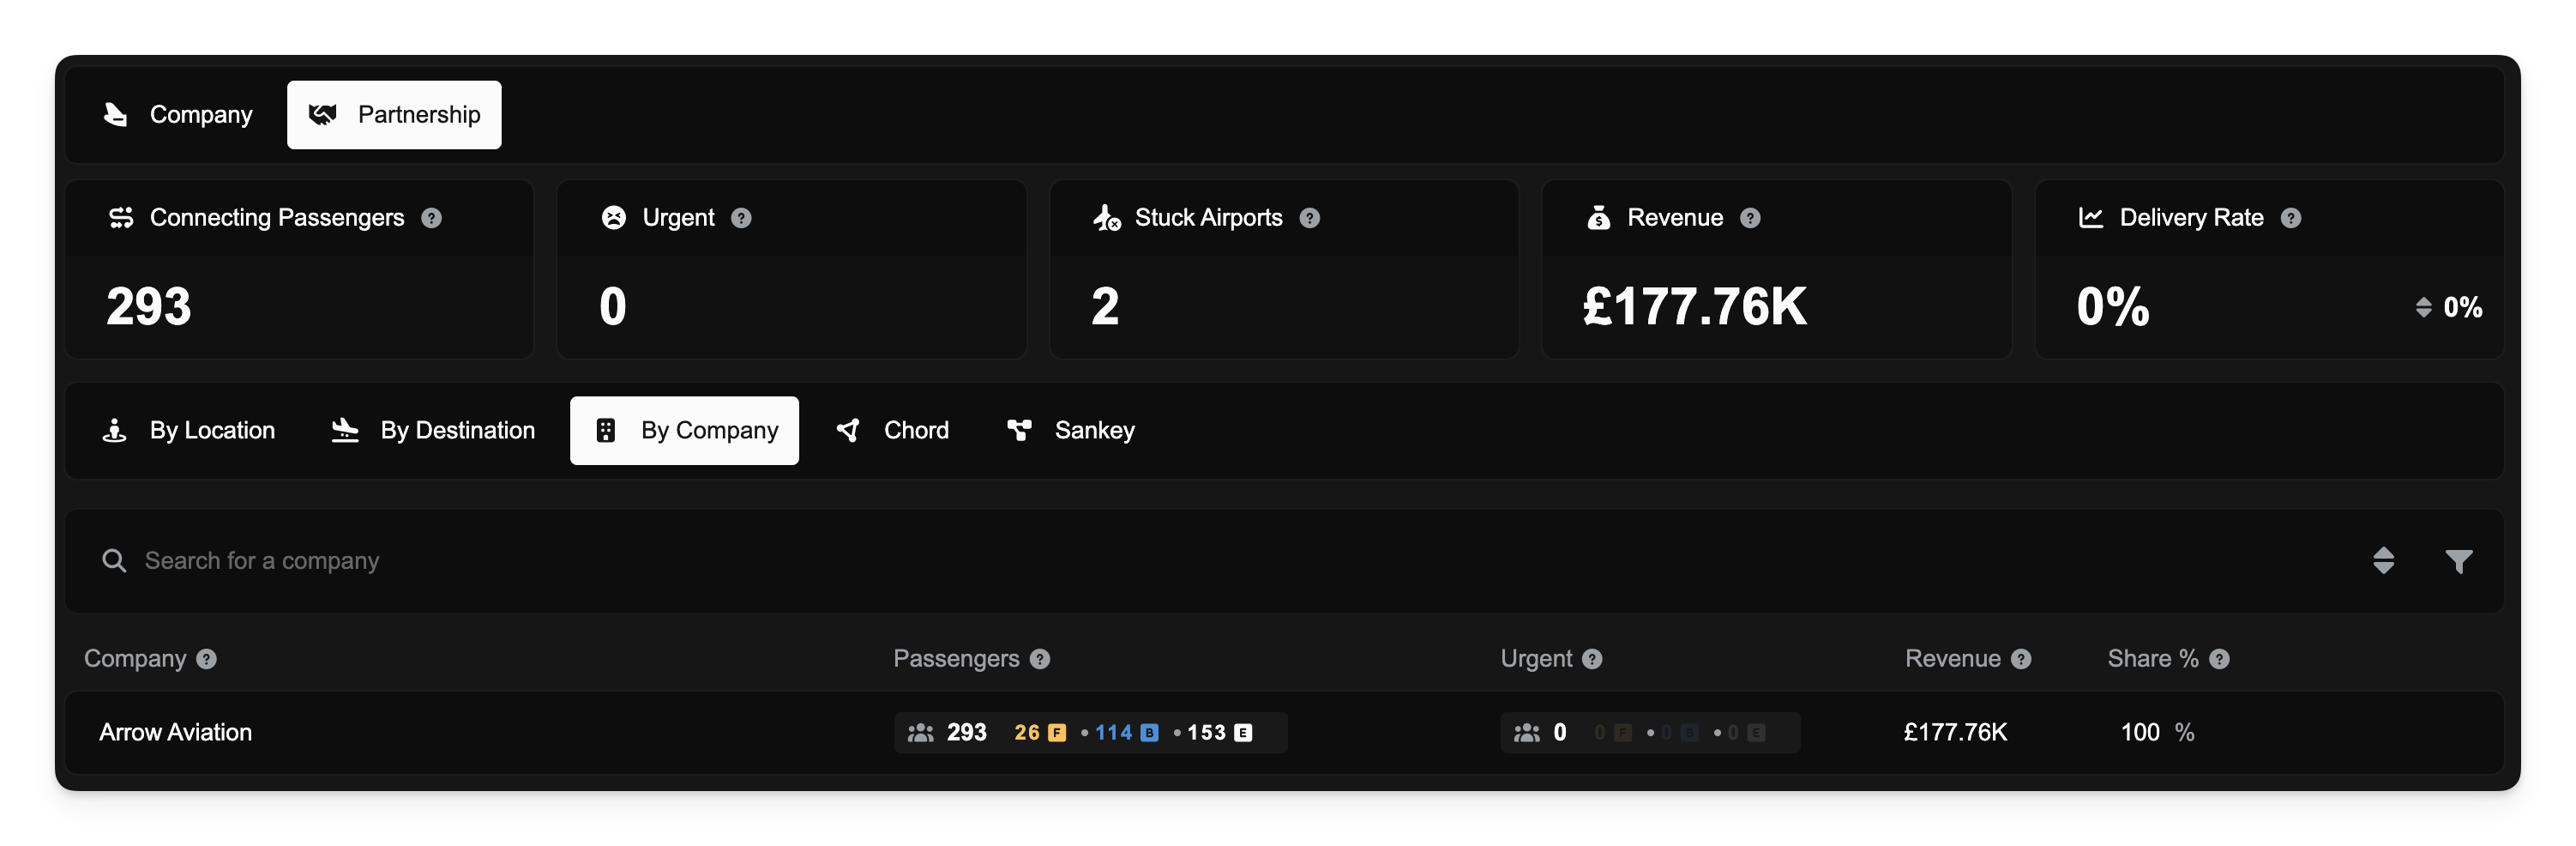
If you are viewing the dashboard with the Partnership scope selected, an additional tab titled By Company becomes available.
This view breaks down the collaborative demand by the member company that originated it. It displays the Share Percentage, allowing you to see exactly how much each partner is contributing to the total collaboration pool. This is useful for auditing contribution levels and revenue distribution within a partnership.
Releasing Collaborative Demand
Sometimes, you may find that you cannot fulfill certain collaborative demands, or passengers have been waiting too long. To maintain network health, you can release these passengers back to the public pool. Once released, any company in FSCharter can pick up these passengers.
Note: Releasing demand is irreversible.
Global Release
If you have the Release Collaborative Demand privilege, you can perform bulk releases directly from the metrics panels when viewing the Company scope:
Release All: Click the red button in the Connecting Passengers panel to release all collaborative demand currently held by your company.
Release Urgent: Click the red button in the Urgent panel to release only those passengers who have exceeded the waiting threshold.
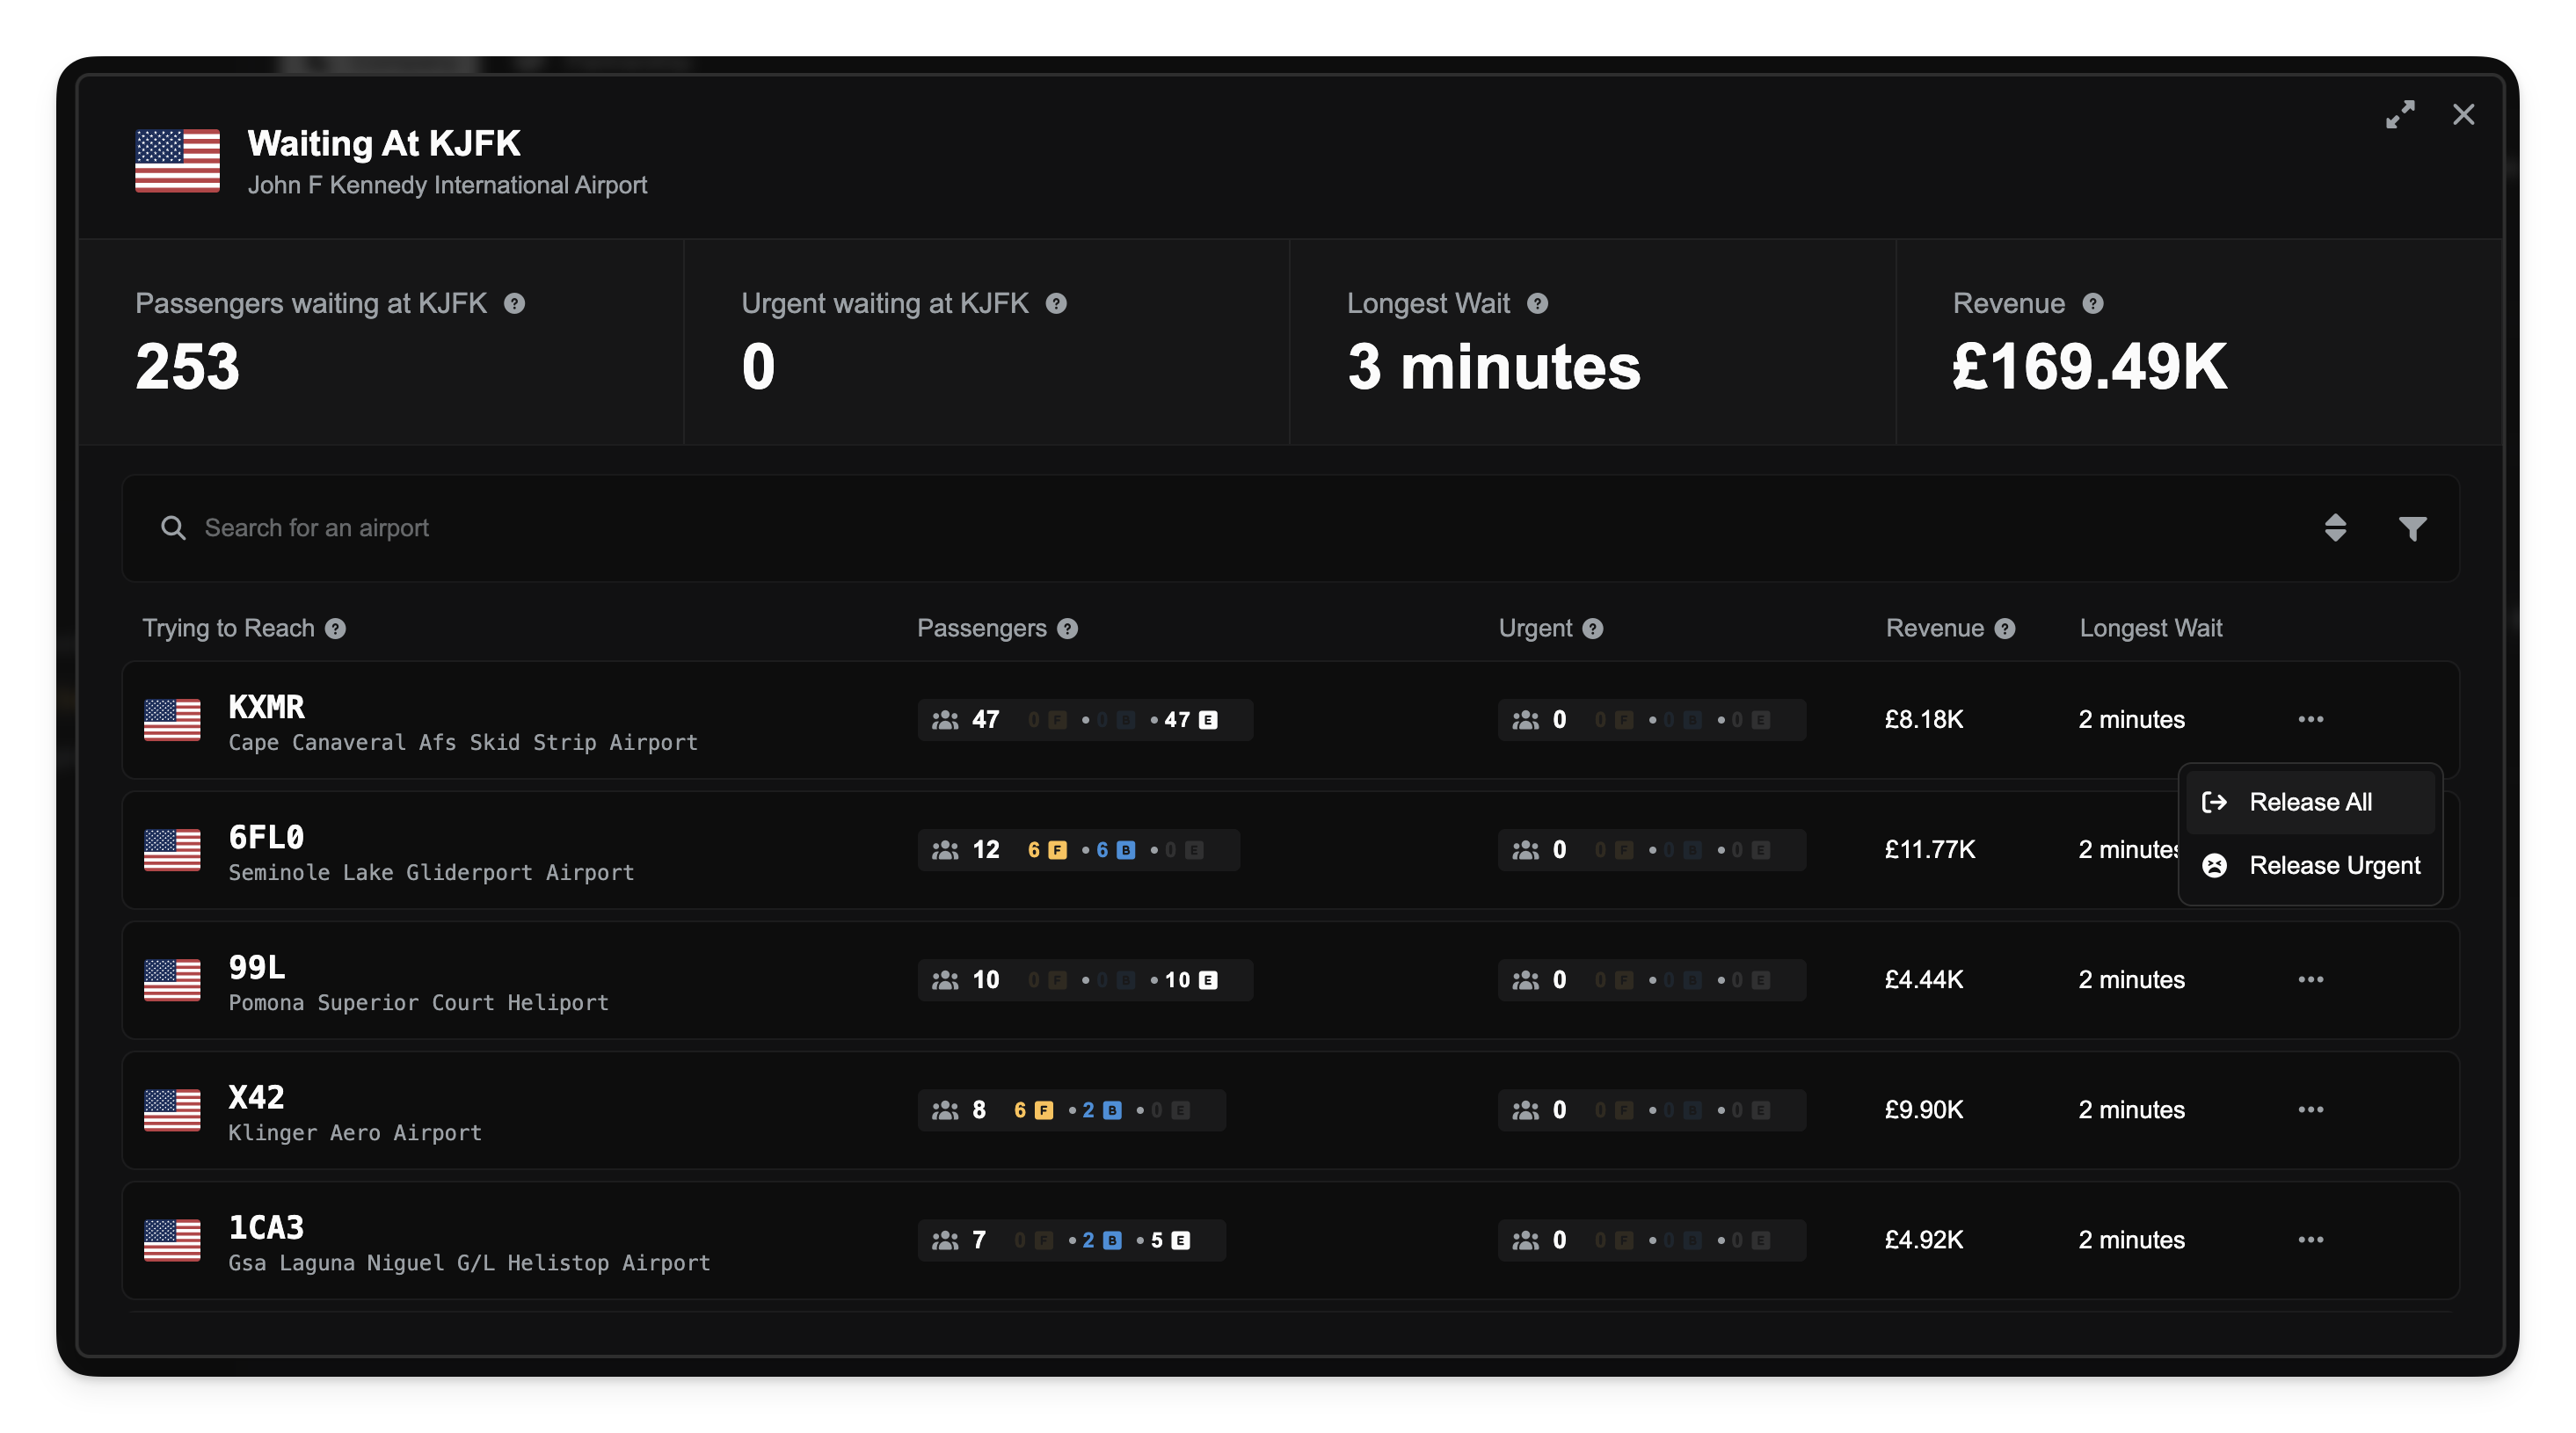
Targeted Release
You can also release demand for specific airports or routes:
Click on an airport in the By Location or By Destination list to open the detail dialog.
In the actions column (represented by three dots or a menu icon), select Release All or Release Urgent.
Confirm the action in the popup notification.
If you leave a partnership, any collaborative demand originally owned by your company will automatically be returned to your internal audience.
Pricing Strategies for Collaborative Demand
To help move "stuck" passengers, a new filter has been added to the Pricing Strategies configuration in the Operations Cockpit.
You can now create a strategy specifically for Demand Waiting For Days.
Navigate to Operations Cockpit > Pricing Strategies.
Create a new strategy or edit an existing one.
Under the Demand Filters section, look for Waiting For Days.
Enter a number (e.g., 10).
This strategy will apply your specified discount/price change only to collaborative passengers who have been waiting longer than the number of days you entered. This is an excellent way to incentivize the movement of urgent passengers without discounting your fresh demand.